
5 main reports of Growth Center include:
Business performance
Traffic insight
Product insight
Promotion insight
Operational performance
Sellers can access the Growth Center in 2 ways:
1. Select Growth center in the Seller Center menu.
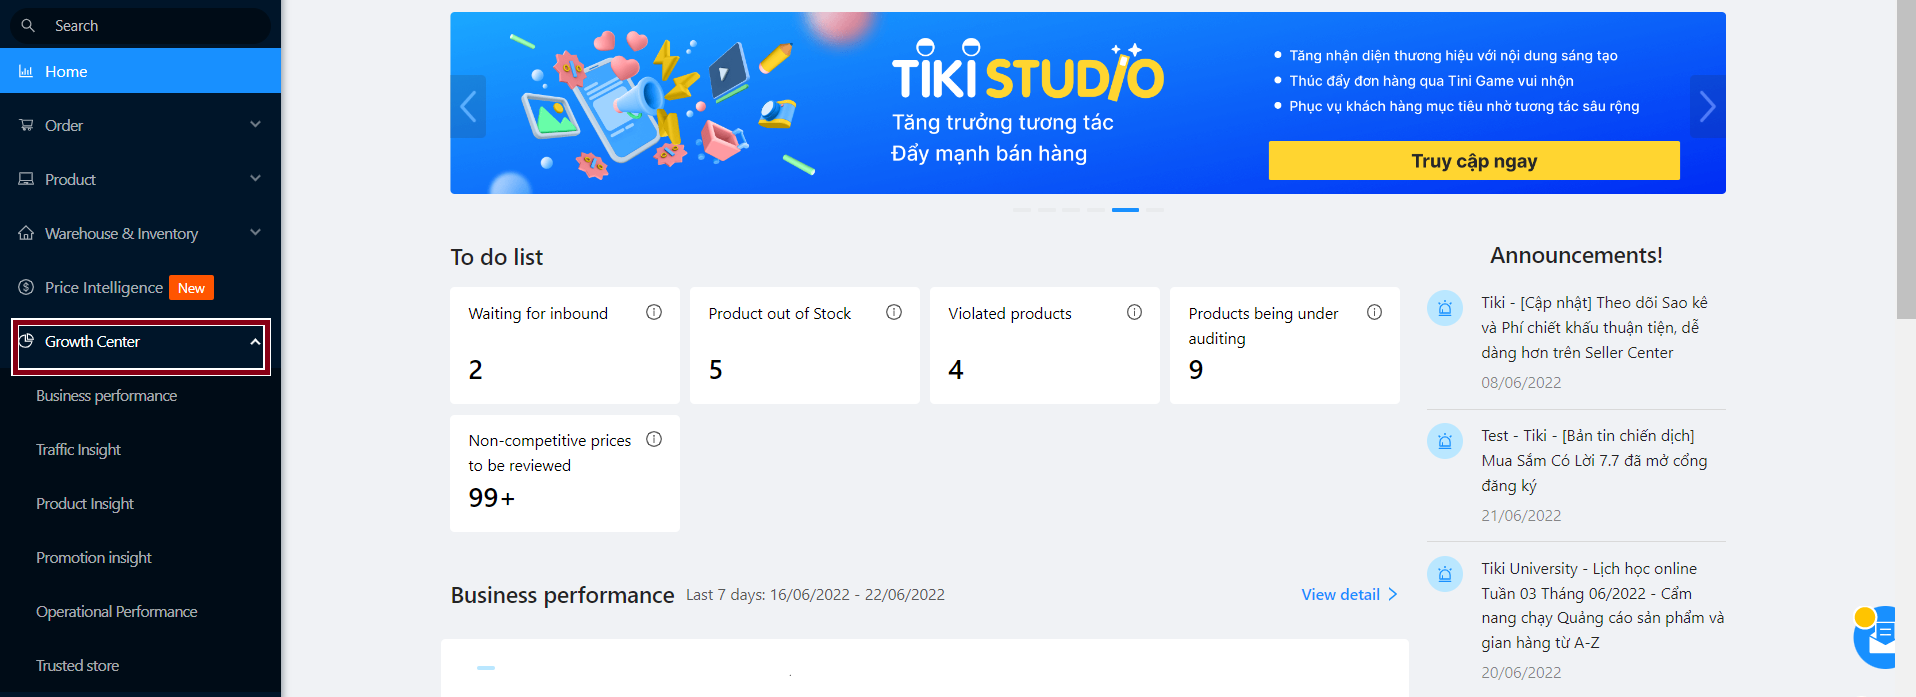
2. Shortcut on Seller Center’s homepage
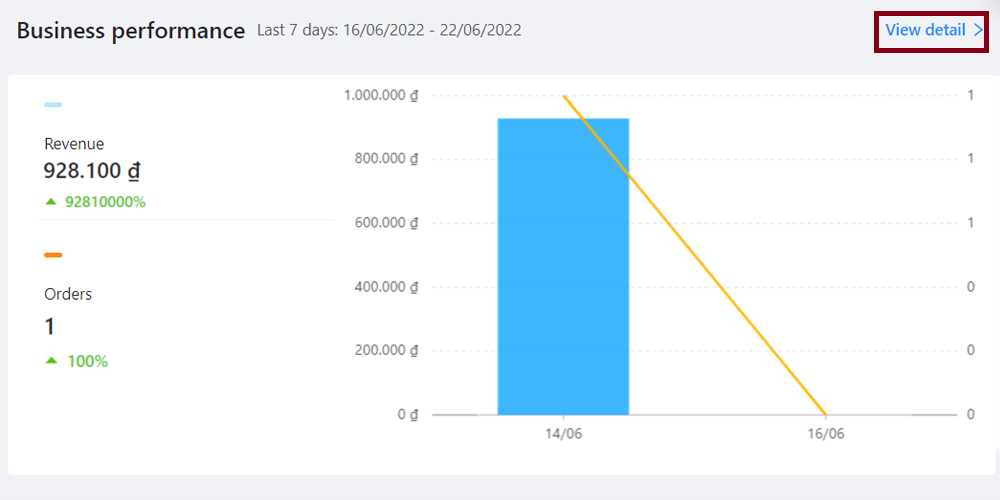
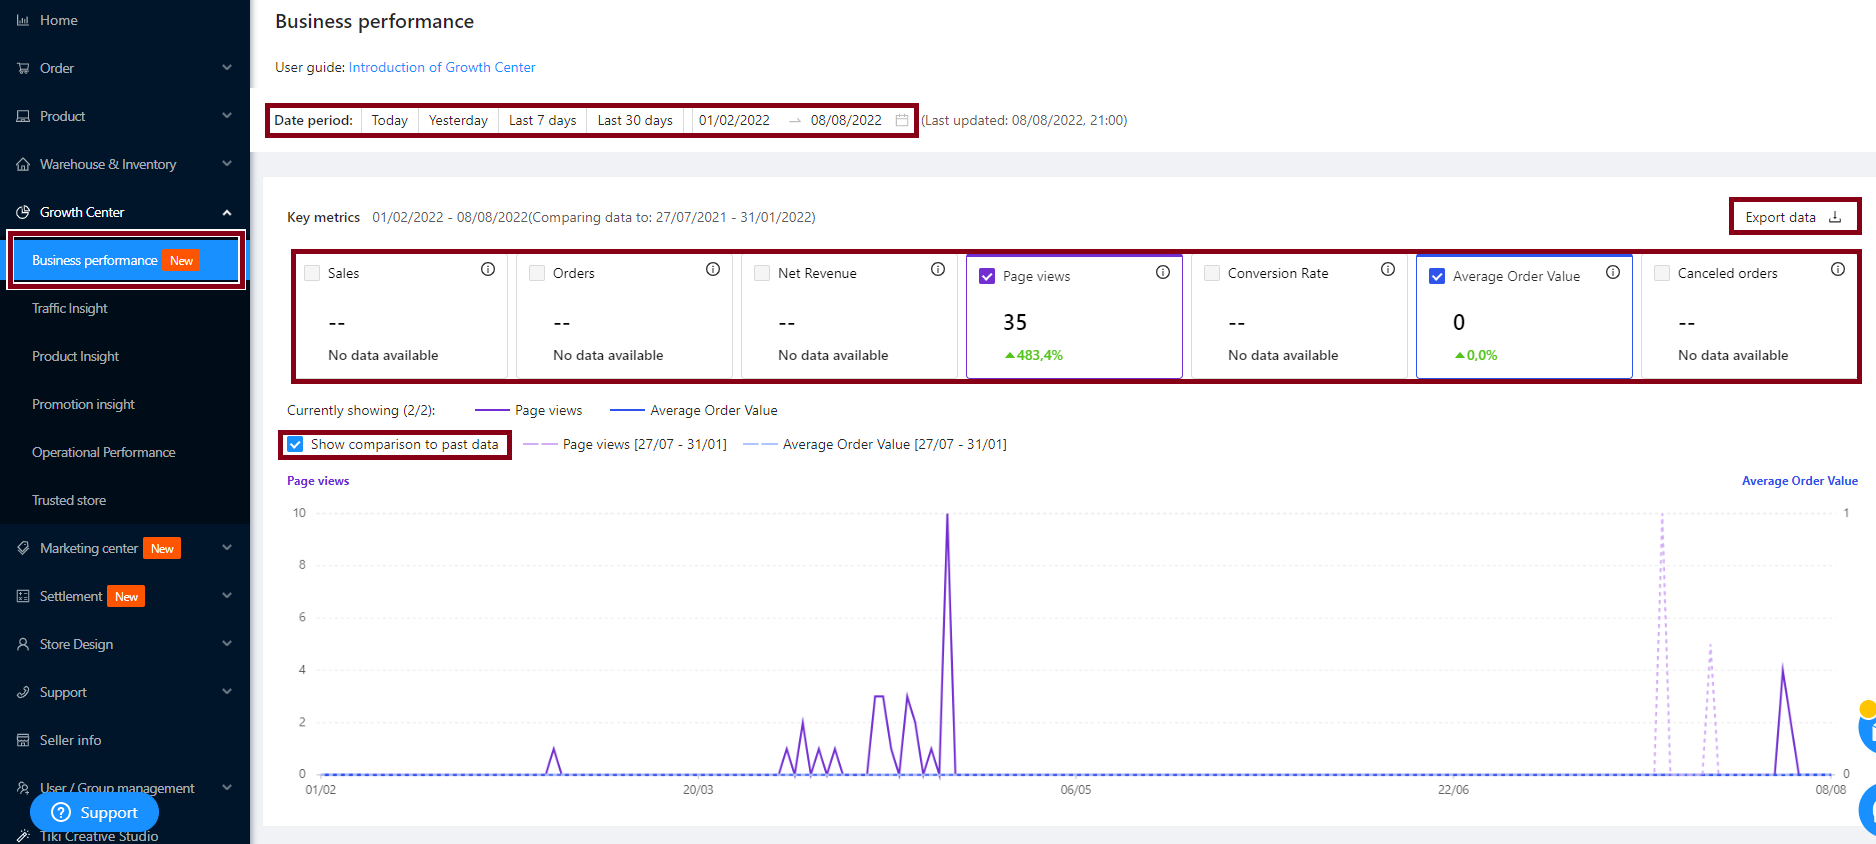
Allows you to track and view reports on your business performance.
1. Sellers can filter data in the section Date period by hour/week/month/year (<=1 year) or specific date.
2. On the Key metrics chart, you will track business performance statistics by Sales, Orders, Net Revenue, Page views, Cancellation rate, Average Order Value, Cancelled orders, Top 10 products, Top 10 cities (Sellers hover over the icon (i) to see the meaning of each indicator). In addition, you can choose up to 2 any metrics to display on the chart.
To see a comparison of past metrics, please tick the box Show comparison to past data and it will be displayed as a dashed line on the chart.
3. To view and manage detailed reports, click on Export data.
Allows sellers to track metrics related to visits and conversion rates based on Total number of buyers / Total number of visitors.
1. Sellers can filter data in section Date period by hour/week/month/year (up to 1 year) or by specific date. In addition, you can view the details by Product detail pages / Store page or by Devices (Mobile or PC).
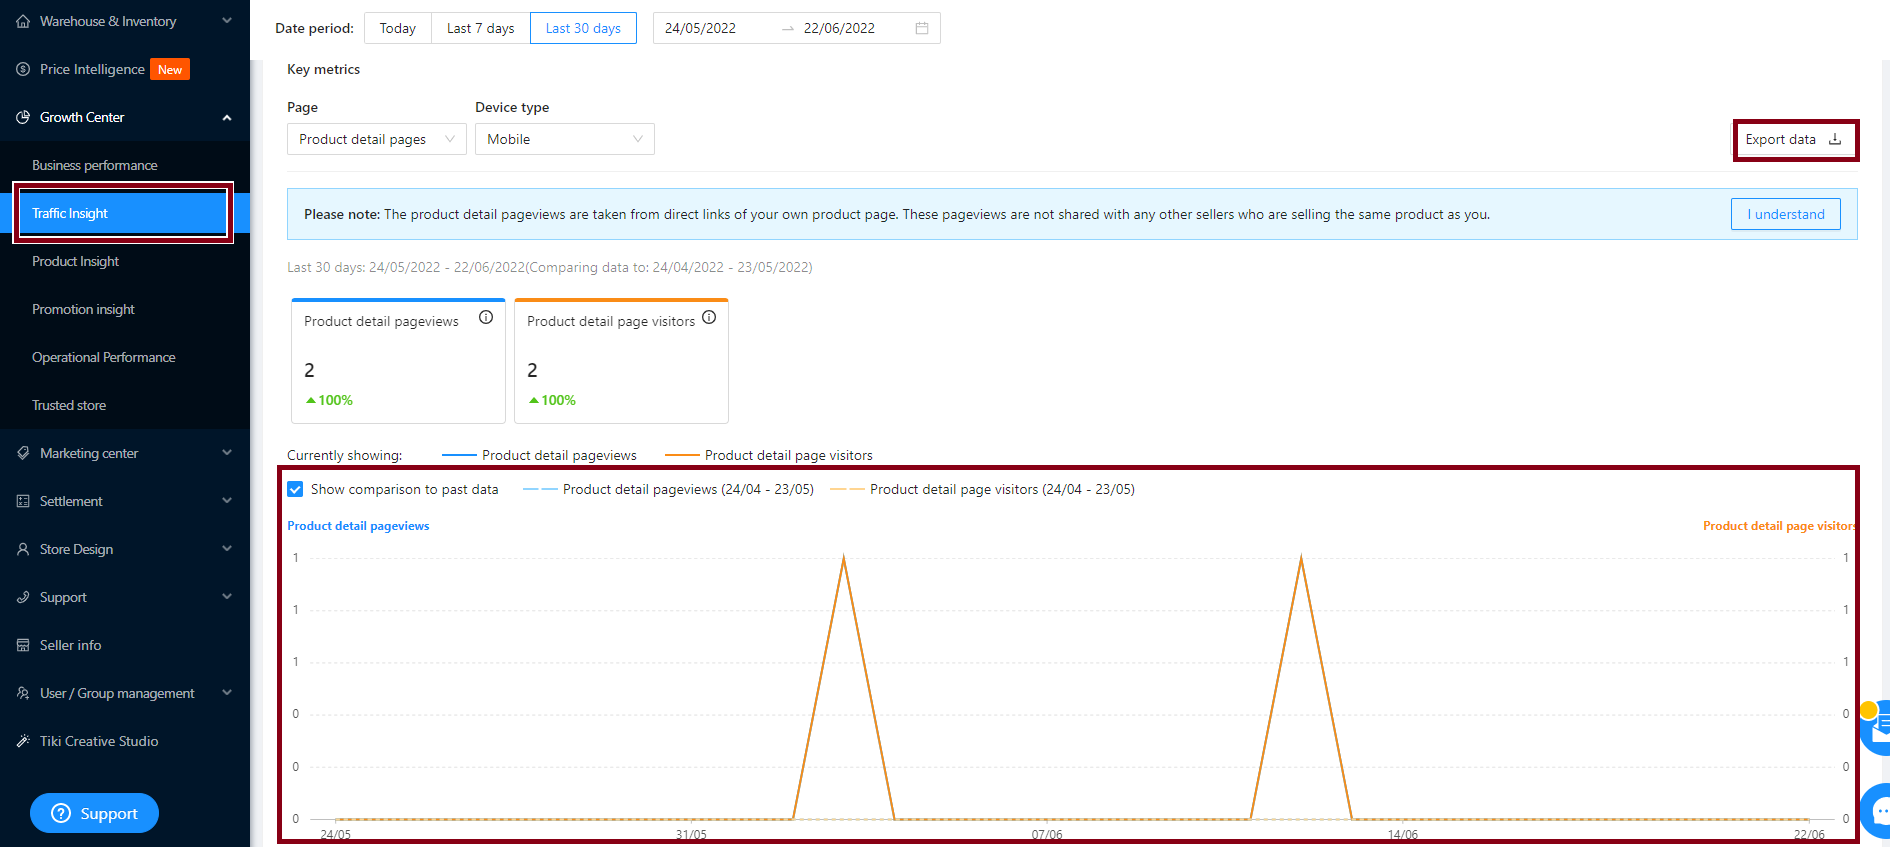
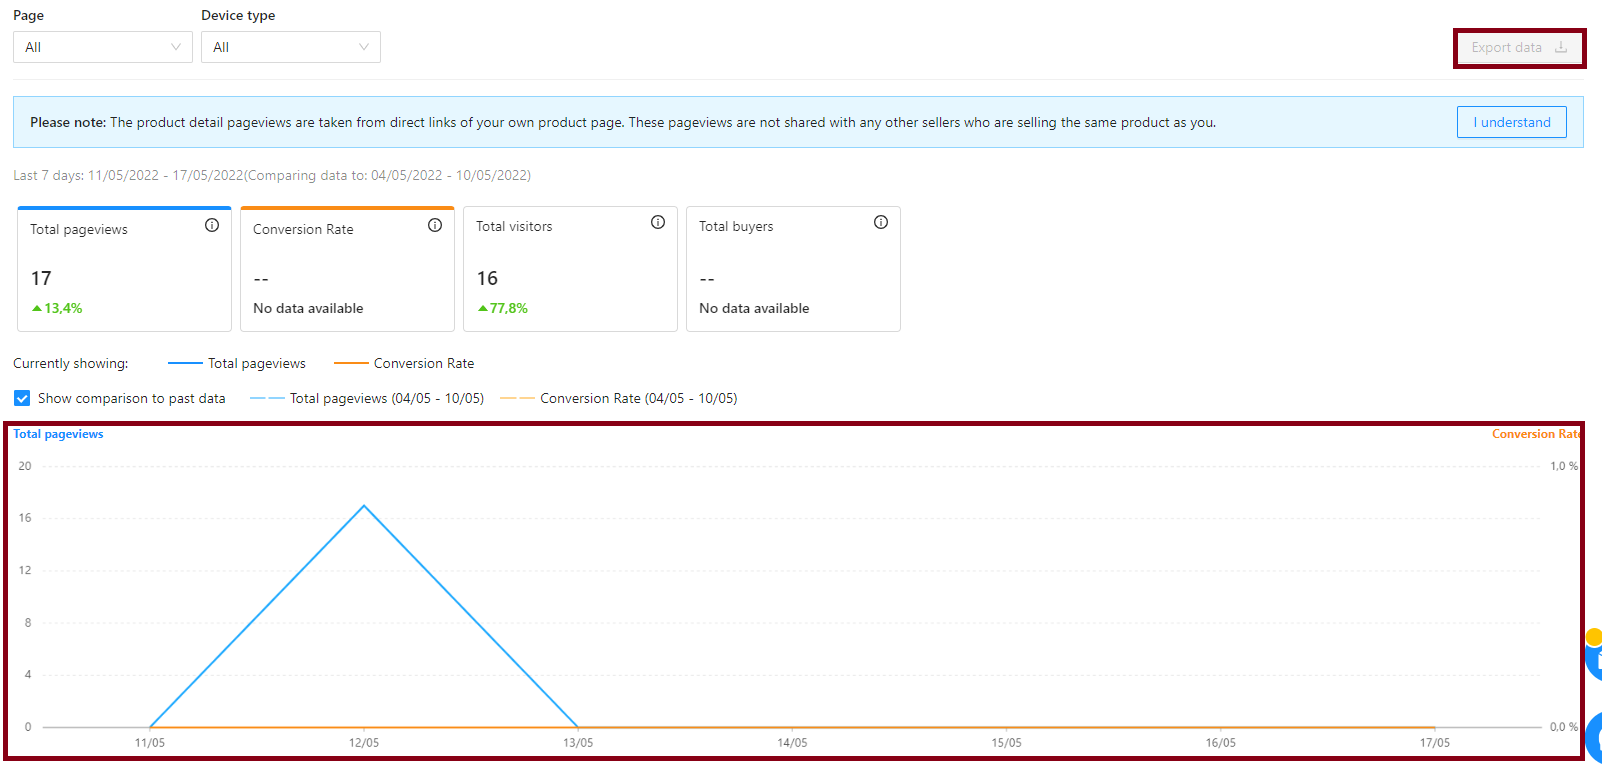
2. On the main chart, you may track the store traffic insight by Total pageviews, Conversion Rate, Total visitors, and Total buyers (Please hover over the icon (i) to see the meaning of each indicator).
To see a relative comparison with the same period of past data, please tick the Show comparison to past data. Past data will be shown in dash lines.
3. To view the detailed report, click on Export data.
Note: The product detail pageviews are taken from direct links of your own product page. These pageviews are not shared with any other sellers who are selling the same product as you.
You can view reports on specific indicators at the level of each product in this feature, thereby helping you to:
Keep track of the sales performance of each product: from there determine strengths and weaknesses of the product through the data of page views, conversion rates, thereby having a specific plan for running ads, or participate in promotions.
Plan to increase/decrease inventory in accordance with the business situation: Keep track of the product’s performance through revenue and inventory to build up a good inventory plan.
Improve the weaknesses of product sales performance: Identify products that have not met the store’s goals or have a tendency to reduce sales performance, thereby drawing out suitable solutions to such issues.
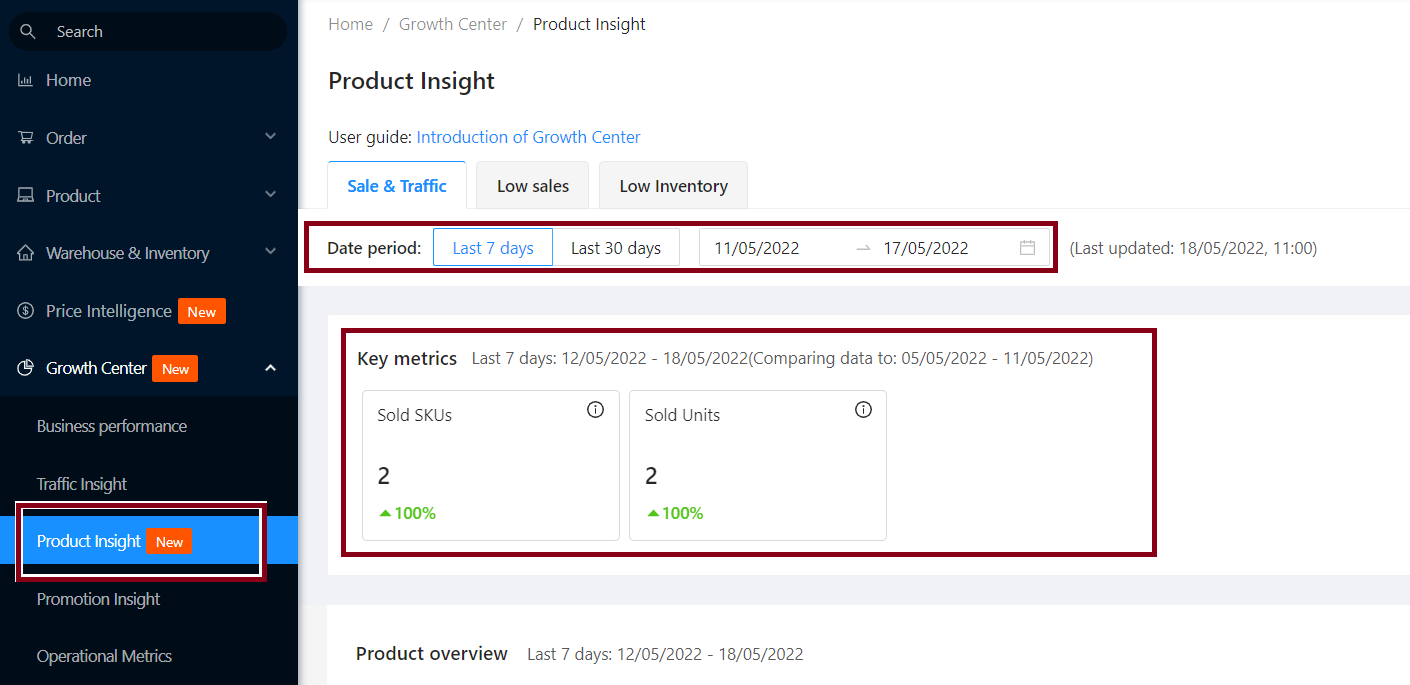
The product index consists of 3 parts:
A. Sales & Traffic: Shows the relevant metrics for each product’s sales and visits.
1. Sellers can filter data in section Date period by week/month/year (up to 1 year) or by specific date. In addition, you can view details by SKU sold (Total number of SKUs sold) and Sold units (Total number of units sold).
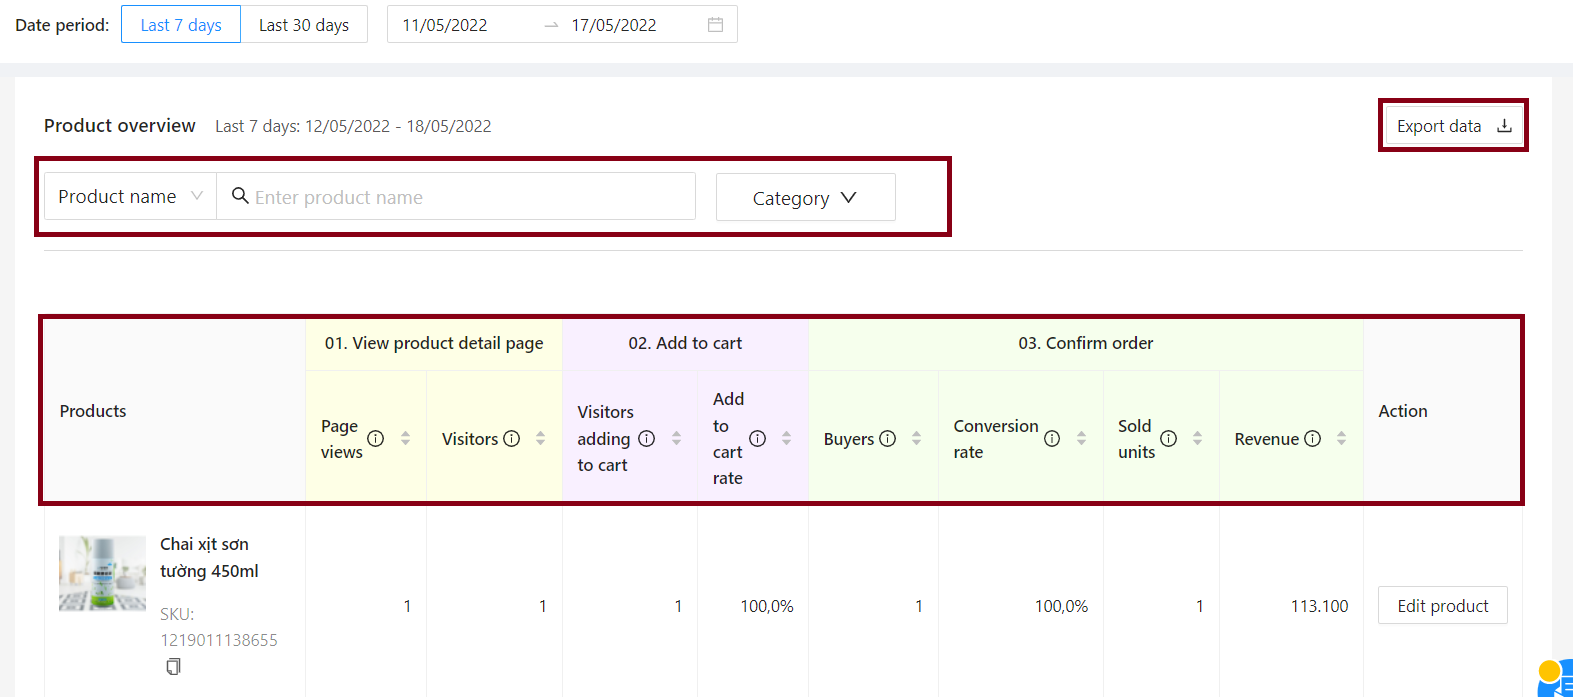
2. In the Product overview section, Sellers can filter and search by: Product (Product Name, Product Code, SKU, PSKU), Category.
Sellers can track metrics such as:
View product detail page (Page views, Visitors)
Add to cart (Visitors adding to cart, Add to cart rate)
View product detail page (Buyers, Conversion rate, Sold units, Revenue, Action). Please hover over the (i) icon to see what each metric means.
For products with multiple variations (variants), the Seller clicks the arrow right in the View variations section. The system displays all the list of variants that are grouped into the main product for the seller to easily manage and customize.
In the Action column, click Edit if you want to change/add product information.
3. To view the detailed report, the Seller clicks Export data.
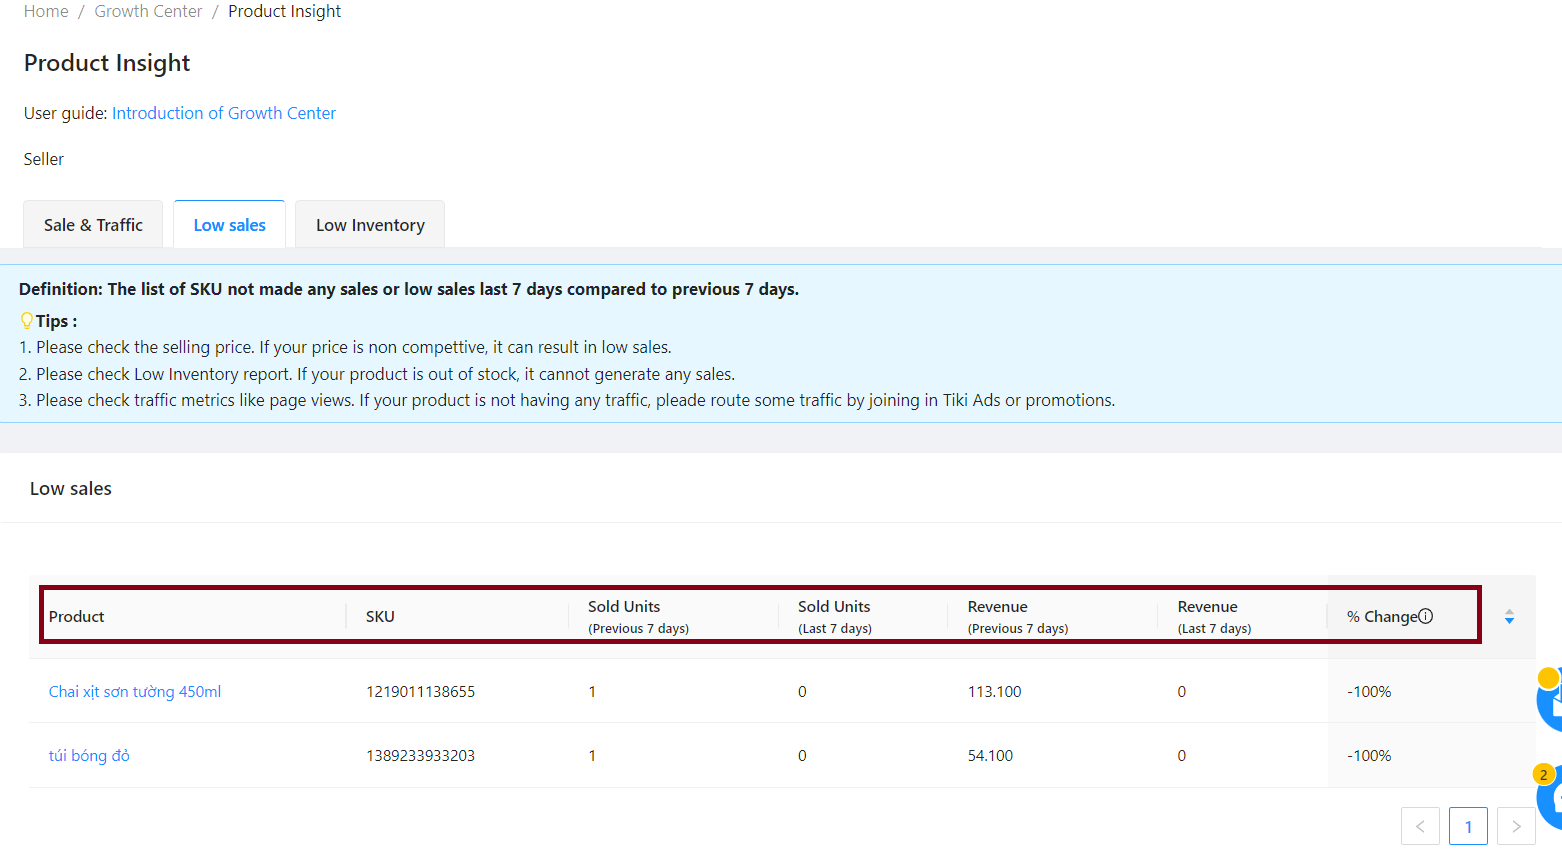
B. Low sales: Displays a list of SKUs with no sales or low sales records within the last 7 days and compared with the previous 7 days. Sellers may track low sales statistics by Product, SKU, Sold Units, Revenue, % Change.
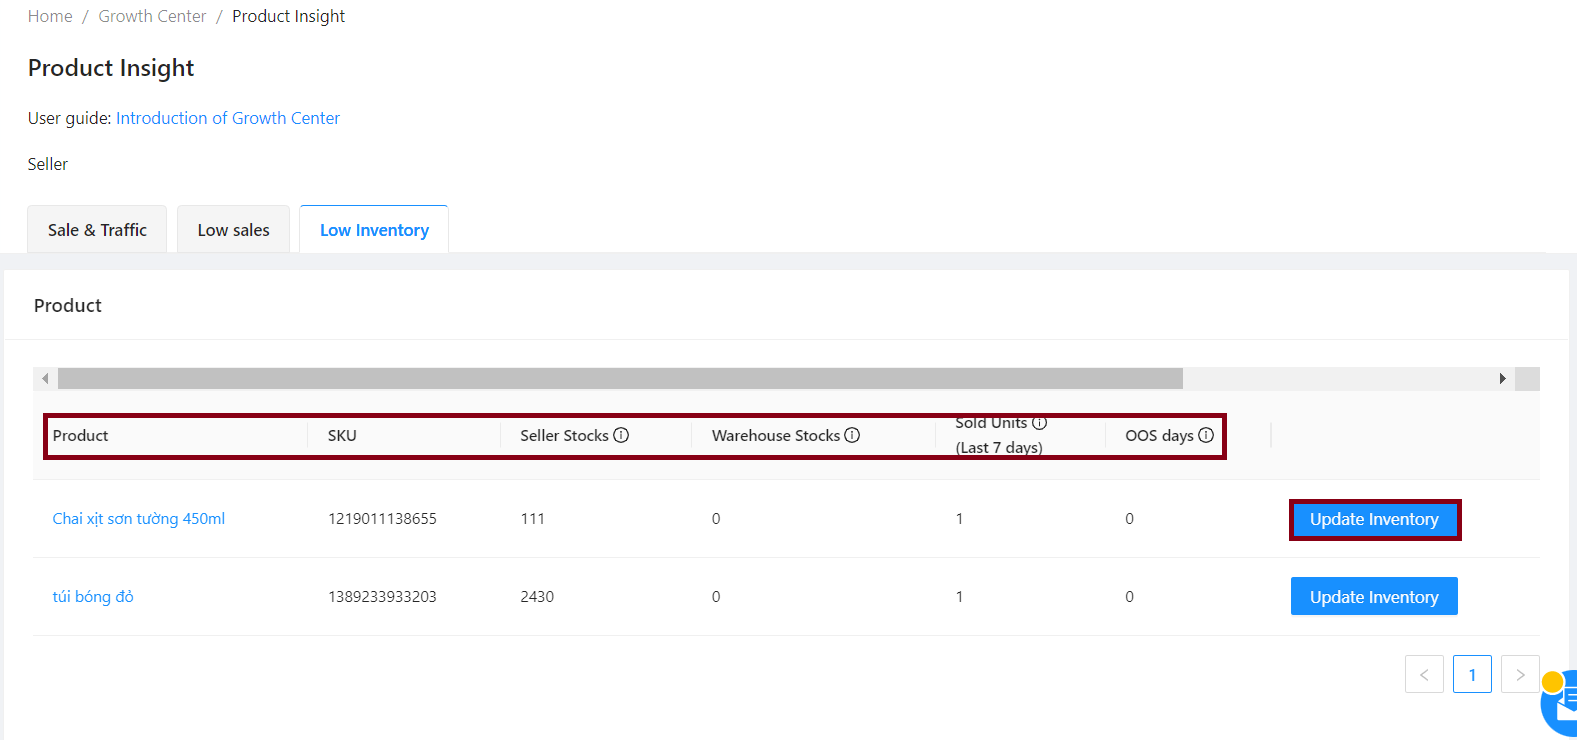
C. Low inventory: Display a list of products with low inventory so that sellers can promptly update the quantity of goods. Sellers will be able to track low inventory statistics on Product, SKU, Seller stocks, Warehouses stocks, Sold units (last 7 days), OOS (out of stock) days.
If the product is about to run out of stock on the system, click Update Inventory.
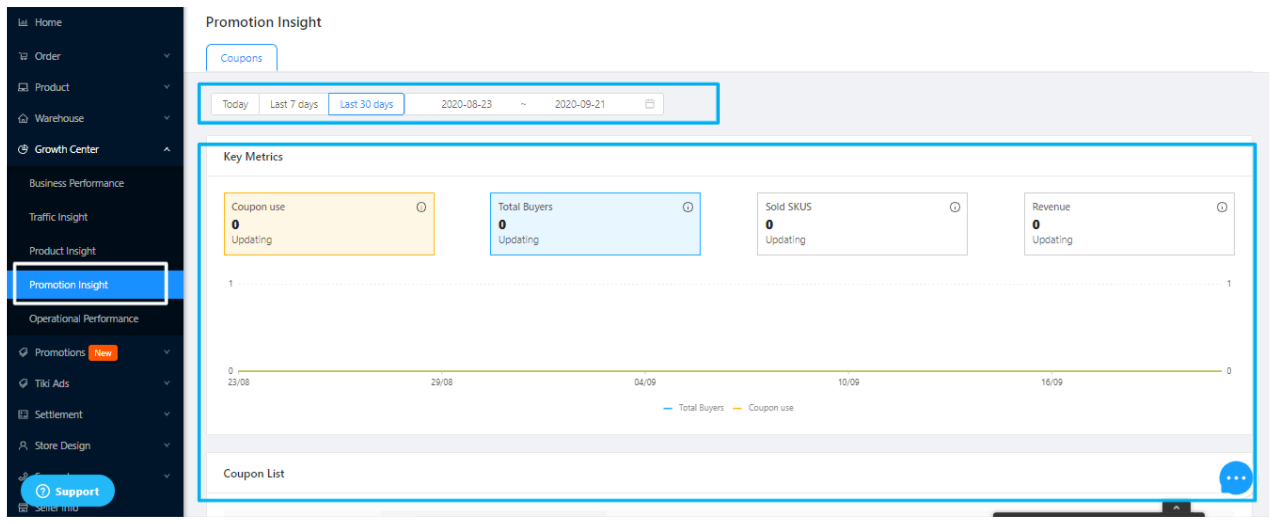
Promotion Insight screen is including the main indicators:
Coupon use
Total Buyers
Sold SKUs
Revenue
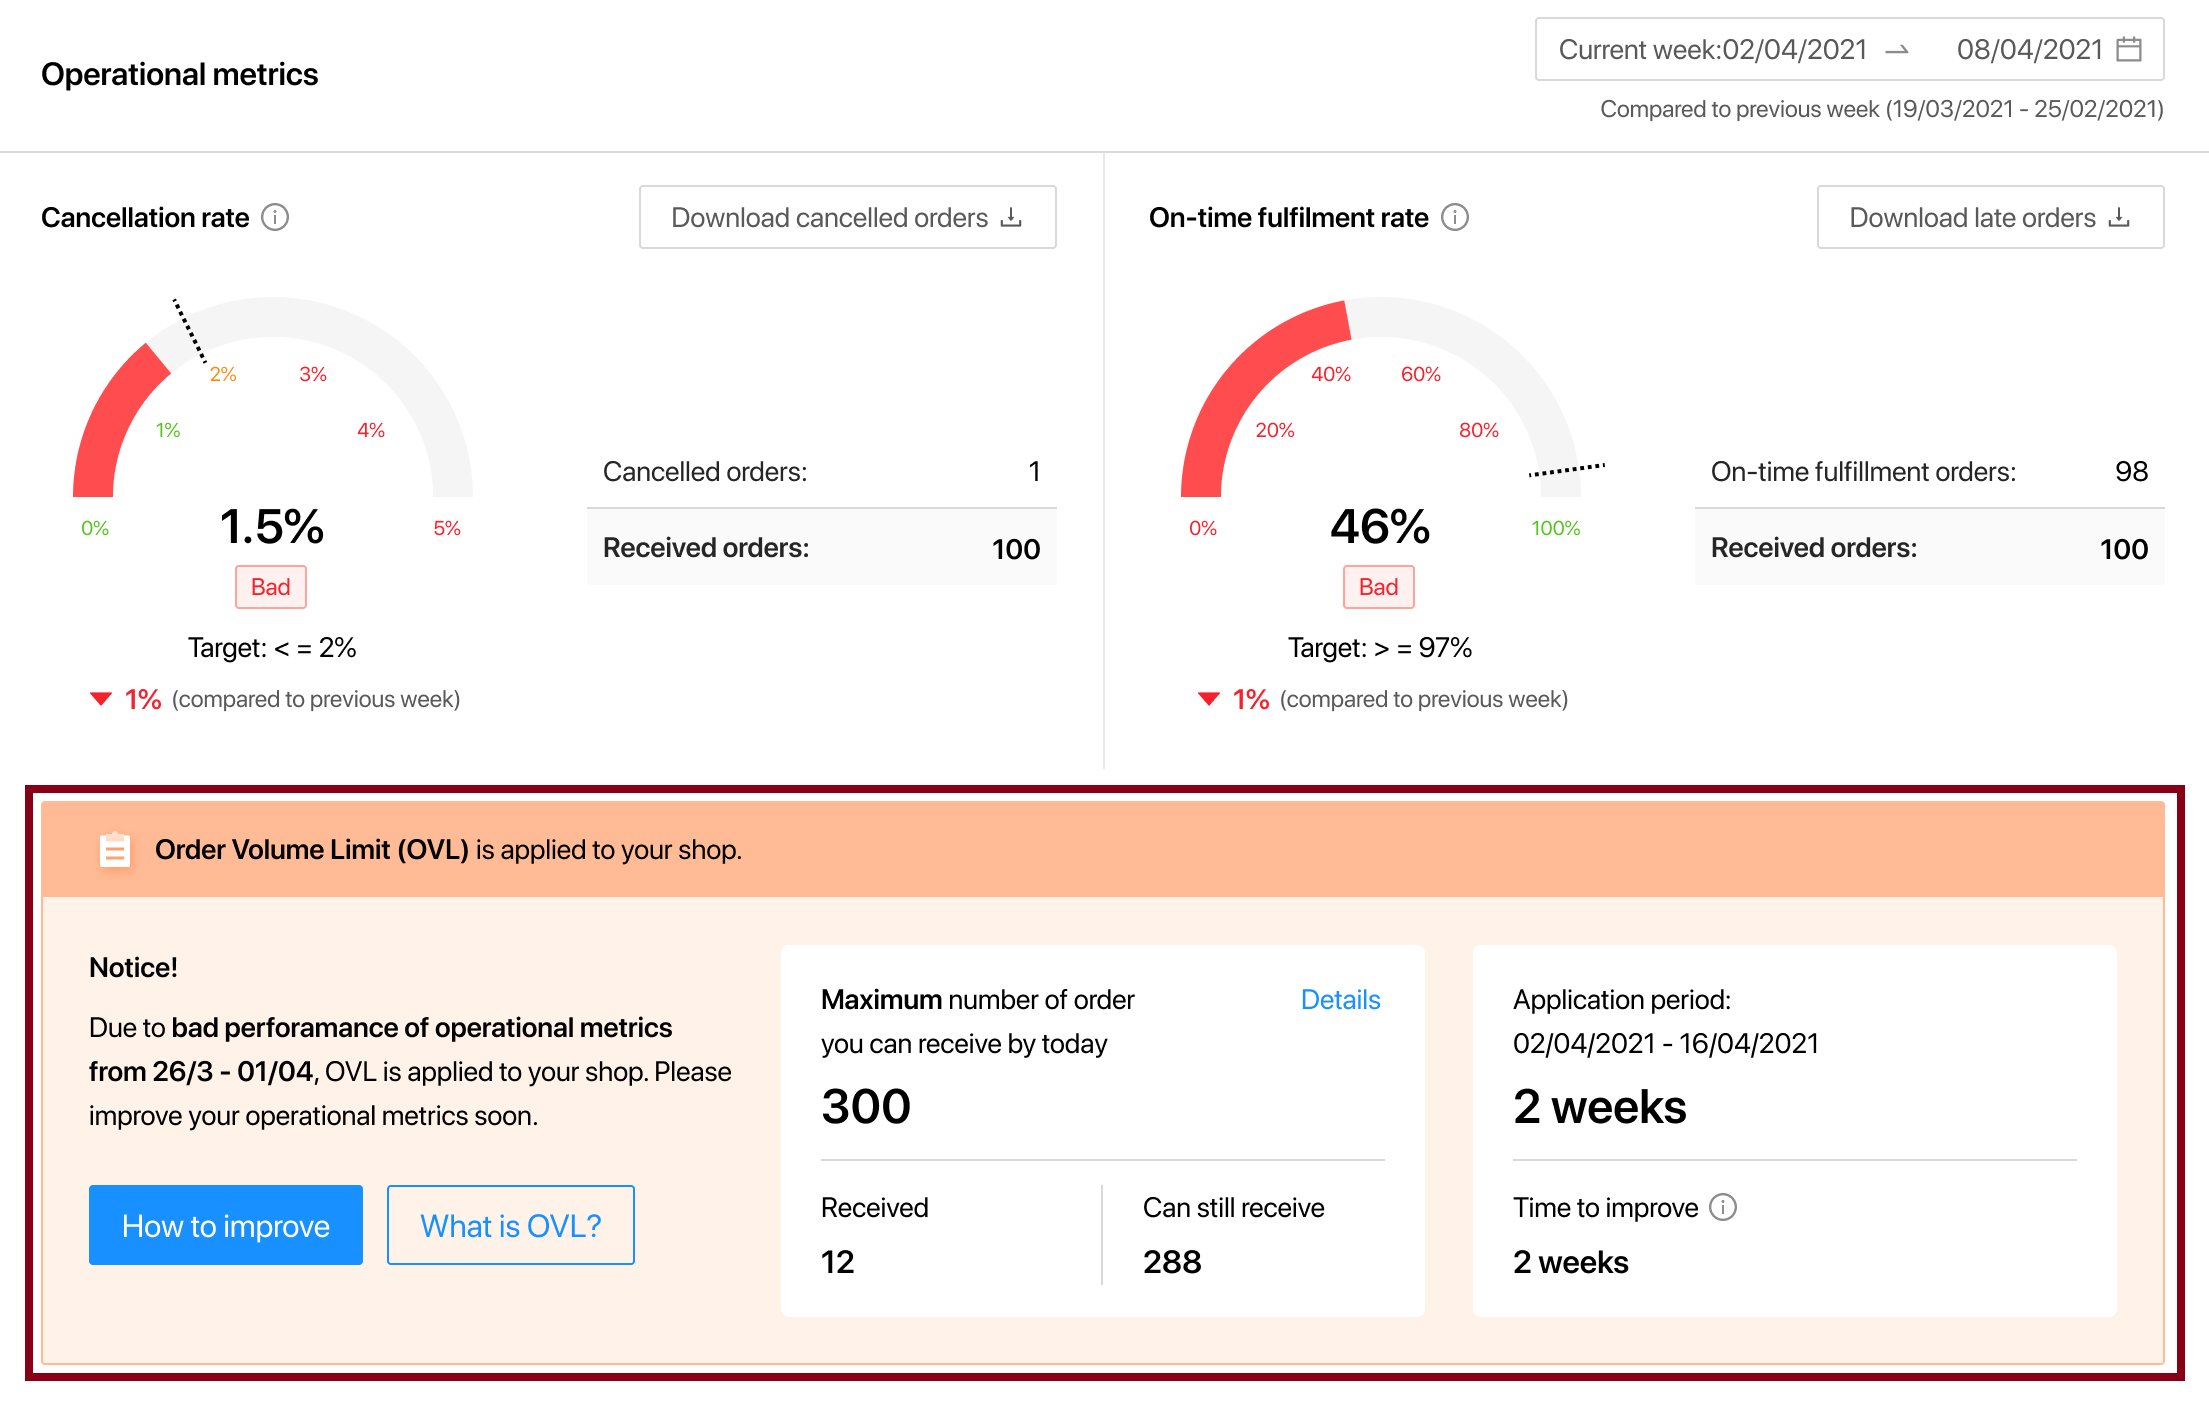
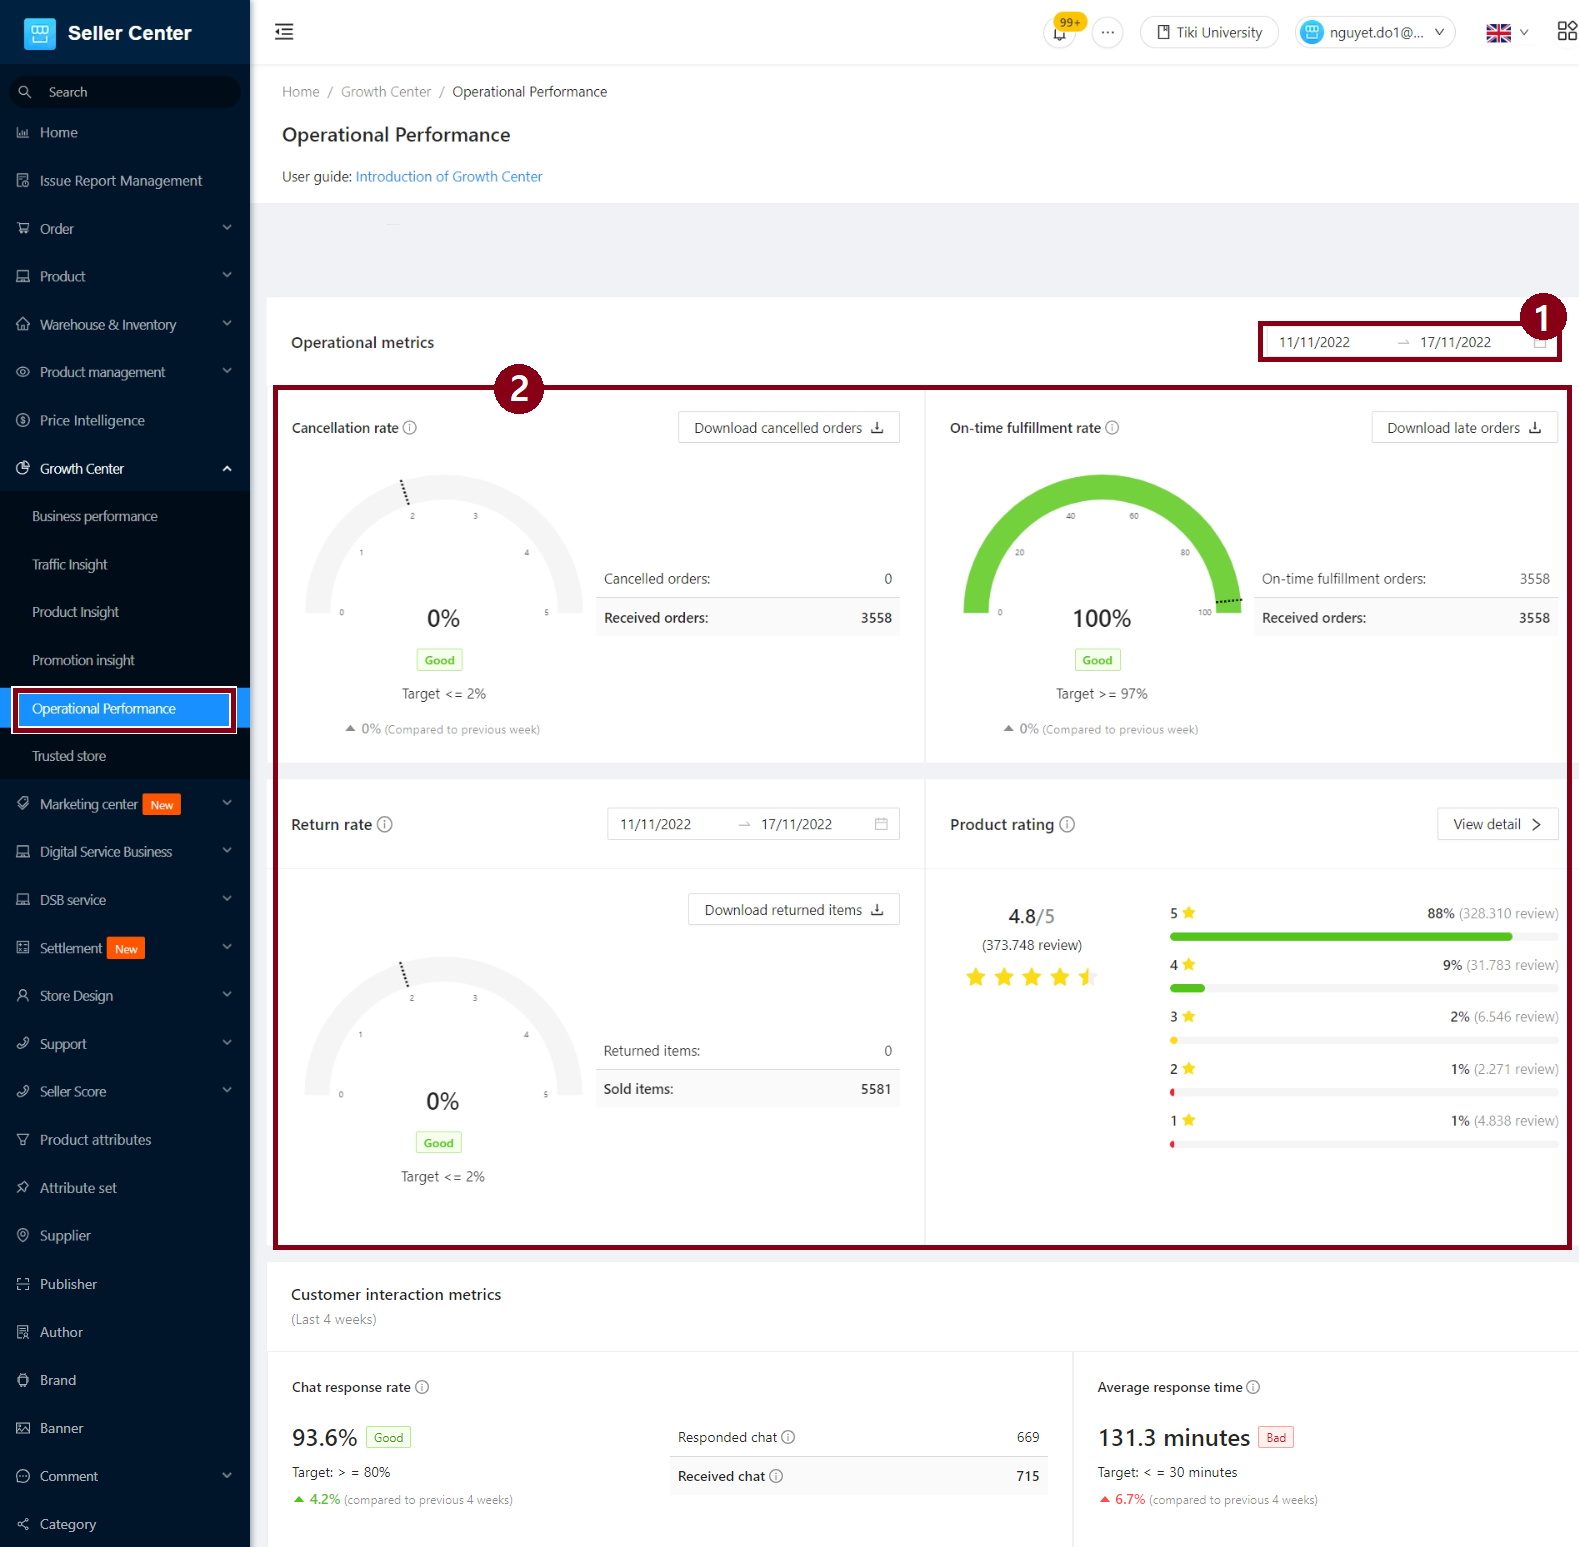
Operation performance is the report to help you track data related to operation as well as customer interaction, thereby helping you to proactively and promptly adjust the operations of your store.
1. Time period filter: You can choose a time period in weeks to filter data.
Note: This filter is only applied to three metrics, including: Cancellation Rate, On-time fulfillment rate, and Return Rate.
2. Metrics included in Operational performance report:
Cancellation rate: Number of cancelled orders (seller’s fault)/Received orders
On-time fulfillment rate: Number of on-time fulfillment orders/Received orders
Return rate: Number of returned items (seller’s fault)/Total items sold
Product rating: The average of all product ratings. To manage reviews, please choose View detail.
Customer interaction metrics: fixed for the past 30 days, including:
Chat response rate: Chat response rate = Responded chat/Received chat. Chat response rate is only calculated when you have received at least 2 chat threads in the last 30 days.
Average response time: Average response time is the average valid time you took to respond to a chat.
(Seller hovers over the icon (i) to see the meaning of each metric).
3. OVL – Order Limit
In addition to the above metrics, this page also shows OVL (Order Limit), which occurs when the Seller has an operating violation rate that exceeds the specified limits. The metrics applied to calculate OVL include: Cancellation rate and On-time fulfillment rate.
OVL – Order Volume Limit is the maximum number of orders that a seller can receive in a day due failure to perform within specified regulations relating to Cancellation rate and On-time fulfillment rate. Monitoring operational metrics will help you become more proactive when operating on Tiki and ensure to minimize the possibility of changing to other operating models or locking products due to violations of operating policies applied to all sellers.
Learn more details about OVL – Order volume limit: here